

How do you report on your results?
As part of your evaluation, you will need to pull everything together in a report. By this stage, you will have your evaluation framework in place and developed some data collection tools e.g. you may have interviewed people, observed them or surveyed them etc.
The data is in and you’ve spent some time analysing and trying to make sense of it all.
Now you need to write it all up. Where to begin?
I use the following simple structure for reporting which you may find useful, particularly if you are doing it for the first time.
Structure of a typical evaluation report
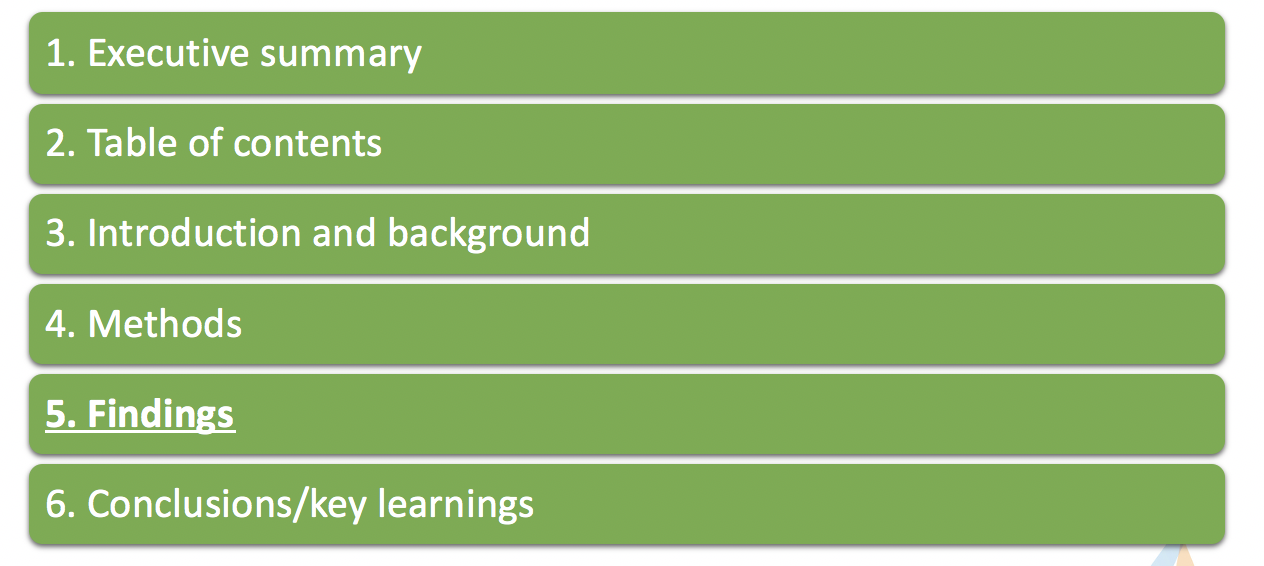
In this post I will focus mostly on the FINDINGS section. However, below are my top tips for writing the other sections.
1. Executive Summary
What is it? A short standalone section (2-3 pages), considered to be a condensed version of the report.
It should summarise the purpose, key findings and conclusions of the evaluation
Spend time on this because many people only read this and not the full report
Write it at the end once you have completed all the other sections
2. Table of contents
What is it? A list of headings and page numbers
Ensure your headings are easily scannable. It will help guide the reader through the key findings
3. Introduction and background
What is it about? States the evaluation purpose and key questions e.g. did your program deliver the outcomes you expected?
Here is where you include background information for context i.e. a brief description of the program and who it is for
It should also include a summary of intended goals e.g. theory of change and evaluation framework (include appendices if helpful)
Keep it short and concise. Avoid lengthy descriptions of the program
4. Methods
What is it about? Outlines the research methods used e.g. qualitative/quantitative
Be sure to describe any limitations with the methodology
It is important to be transparent and accurate e.g. if you didn’t get the response rate you were expecting, just state this up front and explain what it means for the results e.g. they are indicative only, further research is required, but the results are still useful to help us x, y, z.
5. Findings
What is it about? An organised summary of your data in a way that describes whether and how well the program has met its intended goals.
This is where you include your data analysis and key insights i.e. you describe the data and interpret what it means
Use your evaluation framework to help structure this section
For more information see ‘how to write a findings section’ see below
6. Conclusions
What is it about? This section should include the main things you have learned
This may include a list of suggestions for modifying the program (recommendations) or questions the findings have raised e.g. did it challenge your thinking or Theory of Change?
For more great practical tips I find these sites really helpful:
https://knowhow.ncvo.org.uk/how-to/how-to-write-an-evaluation-report
www.betterevaluation.org/en/evaluation-options/final_reports
How to write the findings section?
The findings section is important because it provides the backbone for the rest of the report.
It’s easy to go down wormholes when writing this section. You may be tempted to ask lots of questions of the data as you analyse it. That’s fine, but try to keep in mind the ultimate question you are trying to ‘answer.’
The diagram below provides some steps to help you navigate your way through the ‘findings’ sections, particularly is you are doing it for the first time.
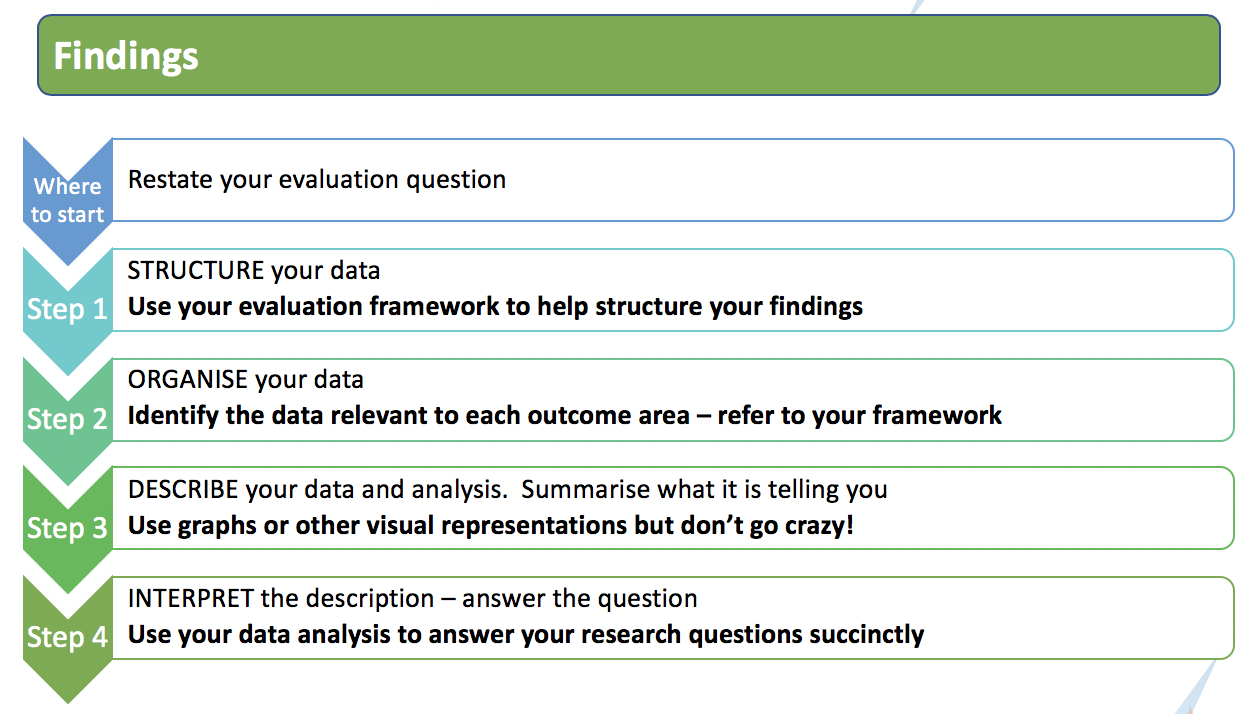
Where do I start?
It is a good idea to begin this section with an introductory statement to help remind the reader (and yourself) about the key evaluation question. This will keep you focused.
For example:
The key question examined in this report is:
Did ‘Project X’ deliver the outcomes we anticipated it would for participants?
In this section we give an assessment of the extent to which ‘Program X’ delivered the outcomes defined in our impact evaluation framework.
We have examined outcomes in the following outcome areas:
X
Y
Z
Unexpected outcomes
Step 1 – 2 (Structure and Organise)
Use your evaluation framework to structure and organise the data you have collected. This simply means:
Step 1: use the outcomes defined in your framework as headings in your report
Step 2: identify any data you have collected that is relevant to each outcome and organise it under those headings (some may be relevant to more than one outcome)
Step 3 – 4 (Describe and Interpret)
The next step is to describe what the data is telling you about those outcomes and try and interpret what it means.
Be sure that it is clear when you are describing something as opposed to when you are interpreting it.
Tops tips
Keep it succinct and use plain English - avoid acronyms and technical language
Don’t forget to include a section on ‘unexpected outcomes’
Use comparison data or contextual data where possible to give your results meaning
Where appropriate use data visualisations to bring your results to life e.g. graphs, info graphics etc.
Below is an example to help illustrate steps 1-4 working through the outcomes articulate in a sample evaluation framework.

Helpful online tools
Here are some handy free and low cost tools I have used in the past to help with reporting writing. There are lots out there. Find the ones that you like and work best for your needs.
Sample size calculators – great to help you understand how many people you should survey (in the design stage) and how confident you and your readers can be in your results. One I have used in the past is:
https://www.surveysystem.com/sscalc.htm
Word Cloud’ generators – help you visualise common words used in open text responses. One I have used in the past is:
Data visualisation software – great for producing engaging graphs and other graphics. Helps bring your results to life. One I have used in the past is:
Ethical considerations in reporting
There are ethical considerations to keep in mind when you are designing your evaluation and collecting data. But there are also important ethical considerations to think through as you report your results. Sometimes these are not always obvious.
Here are some things to keep in mind when you are writing up your report.
For more information on ethics in reporting visit: https://www.aes.asn.au/images/stories/files/membership/AES_Guidelines_web_v2.pdf
1. Be accurate and transparent
For example:
Report negative findings – it can be confronting to see negative results, especially when doing self-evaluation. But you mustn’t hide them. Instead, use it as an opportunity to reflect on what worked, what didn’t, consider whether your assumptions were right etc. Funders don’t expect to see perfect results.
Be clear about the limitations of your data e.g. be open about your sample size and what it means for your results. If you have a small sample size say so. Don’t claim it is representative. Instead talk about how results are indicative or illustrative only. Talk about how the results should and shouldn’t be used. Use a sample size calculator to generate a margin of error.
2. Don’t overstate your findings
For example:
Unless you have 100% response rate don’t say ‘all participants’ think this….say ‘people we surveyed’ or ‘respondents’ instead.
Don’t use language like ‘this result proves this.’ Try words like ‘indicates,’ ‘suggests’ etc. instead.
Don’t use percentages if the sample size is low. Use counts instead.
If low counts compromise anonymity/privacy consider combining categories and aggregate responses e.g. disagree/strongly disagree
3. Maintain confidentiality and anonymity
For example:
Always double check you have consent before using quotes or any other identifying data.
Sometimes, because of the sample size or other factors, it may be possible to identify a participant even if they don’t provide their name e.g. their age, organisation or other information they provide might identify them.
If this is the case, and you really want to use a quote, always check first with them before you use the quote etc.
4. Avoid bias
It is always important to check for bias, but especially so when conducting self-evaluations. For example:
Always be aware of own biases, pressures, personal background, values and assumptions. Make them explicit in your report
Give your report to someone else to read to check for possible bias (sometimes it is hard to see your own biases)
5. Don’t use disempowering language
Be aware of the potential effects of differences and inequalities in reporting, especially those related to race, age, gender, sexual orientation, disability, religion, socio-economic or ethnic background etc. For example
Don’t label people in reports e.g. call participants ‘disadvantaged people.’
Think about it from their point of view and how they would feel reading the report.
Get advice if you are unsure.